 |
 |
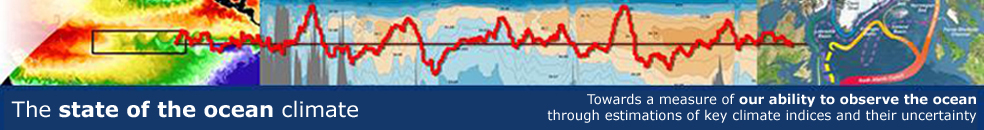
Introduction | Overview | Atmosphere | | Subsurface ocean | Sea Ice Niño3.4The Niño3.4 SST anomaly index is an indicator of central tropical Pacific El Niño conditions. It is calculated with SSTs in the box 170°W - 120°W, 5°S - 5°N. Anomalously warm conditions are associated with El Niño events, which peak in boreal fall/winter. NOAA/PMEL hosts an El Niño theme page with further information on the tropical Pacific. In the full series case, monthly averages are shown by the plus signs, three month running mean filtered index values are shown by the shaded regions. In the "last two years" case, weekly averages are shown by the plus signs and the monthly average values are shown by the shaded regions.The weekly standard deviation of the index over the period 1991-2020 is indicated on the plot.Data sourceThe index is calculated using the Reynolds OIv2 SST analysis, made available by NOAA/ESRL, and is updated weekly (last update 19-JUL-2026). get series (netcdf 24kB) » get error (netcdf 24kB) » CalculationThe anomaly is calculated relative to a monthly climatological seasonal cycle based on the years 1991-2020. The monthly climatology is linearly interpolated to determine weekly anomalies.Spatial averaging of the gridded analysis was weighted by surface area. UncertaintyThe uncertainty of the index is estimated to be 0.05835 degrees C over the period 1982-present, and is based on the uncertainty estimate obtained from the objective interpolation analysis. more details » |
| Dept Of Commerce| NOAA | PMEL | Disclaimer | Privacy Policy | Web Master |